ORIGINAL RESEARCH
Spatio-temporal analysis of non-attendance for the National Abdominal Aortic Aneurysm Screening Program in Cambridgeshire, Peterborough and West Suffolk region between 2018 and 2022 and its link to socioeconomic deprivation
Fung KW,1 Szybka M,1 Lane T,1 Kreckler S1
Plain English Summary
Why we undertook the work: The NHS provides an ultrasound screening programme to detect abdominal aortic aneurysms (AAA), which is a dilatation of the aorta – the main blood vessel in the abdomen. AAA generally do not cause any symptoms until they rupture, which is usually fatal. Non-attendance at these screening appointments may delay the diagnosis of AAA and lead to missed opportunities of early intervention.
What we did: We examined the pattern of non-attendance in the screening programme in Cambridgeshire, Peterborough and West Suffolk, using specialised software to try to identify potential ‘hot spots’ of where non-attendance is higher compared with other regions and investigate any association between socioeconomic deprivation and non-attendance.
What we found: We found one hotspot of non-attendance in Peterborough and three in Cambridge. Degree of deprivation was found to be a contributing factor to non-attendance in Peterborough, but its impact was less evident in Cambridge.
What this means: This information will allow the local screening programme to target interventions to try to increase uptake in these non-attending hotspots in order to optimise early detection of AAA. Future research is warranted to investigate other factors associated with high non-attendance (eg, ethnicity mix, ease of access to screening clinic) and assess the effectiveness of interventions to improve uptake.
Abstract
Objective: Non-attendance for National Abdominal Aortic Aneurysm Screening Program (NAAASP) screening scans results in a lost opportunity to improve public health and has financial implications for the healthcare system as a whole. This study aimed to assess the spatio-temporal distribution of the ‘did-not-attend’ (DNA) rate and identify high-risk geographical areas and associated risk factors for future policy making and allocation of healthcare resources.
Methods: This was a retrospective spatio-temporal analysis of non-attendance to the NAAASP in Cambridgeshire, Peterborough and West Suffolk from 2018 to 2022. With the data from the national AAA screening system, Screening Management and Referral Tracking (SMaRT), the DNA rate was established for each postcode district and compared with the overall DNA rate. Using the number of ‘non-attenders’ in each postcode district, optimised hotspot analysis was performed to identify hotspots of non-attendance for each year between 2018 and 2022. Multiple logistic regression was used to investigate the association between degree of deprivation and non-attendance.
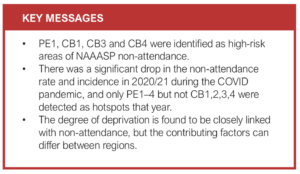
Results: Overall, 6,364 of 23,957 people (26.6%) being called for screening did not attend from 2018 to 2022. Optimised hotspot analysis identified eight statistically significant hotspots of non-attendance. Postcode districts PE10 (n=8, 80%), PE1 (n=433, 44.5%), CB4 (n=331, 40.2%), CB3 (n=114, 36.7%) and CB1 (n=320, 35.8%) were identified as areas with statistically significantly higher DNA rates. PE1, CB1, CB3 and CB4 were high-risk areas with both high DNA rates and high numbers of non-attenders. A consistent spatial pattern of hotspots was observed while there was a significant drop in the DNA rate in 2020/21. While degree of deprivation was closely linked to non-attendance in Peterborough, the link was less obvious in Cambridge with little socioeconomic deprivation.
Conclusion: PE1, CB1, CB3 and CB4 were identified as high-risk postcodes. These areas comprise 12.6% of the total screened population. The degree of deprivation is found to be a major contributing factor to non-attendance. Focusing resources to try and improve attendance in these cohorts should be a more cost-effective approach than targeting the population as a whole. Future research is needed to explore the risk factors associated with high non-attendance in these postcode districts in order to identify actions to improve uptake and access to the screening services.
Introduction
The National Abdominal Aortic Aneurysm Screening Program (NAAASP) offers a screening ultrasound scan to all men aged 65 in the UK by the National Health Service (NHS), with the aim of screening and surveillance of aortic aneurysms. The NAAASP was established after multiple randomised clinical trials showed a significant reduction in the mortality rate with the screening intervention.1,2 Current surveillance schedule in the NAAASP (annually for small AAA of 3–4.4 cm diameter, quarterly for medium AAA of 4.5–5.4 cm diameter) also results in a very low rupture risk of <0.5% per annum, even in men whose AAA is just <5.5 cm, the current referral threshold.3
Non-attendance at the initial screening appointment may cause a delayed diagnosis of AAA leading to themissed chance of early detection and intervention provided by the NAAASP. Attending the screening appointment could provide an additional opportunity for healthcare providers to educate people about modifiable risk factors associated with AAA, instigating behavioural change. Non-attendance also wastes clinical resources including pre-allocated staffing, facilities and equipment. Furthermore, it increases the bureaucratic burden by adding more administrative work for rescheduling appointments, all of which creates inefficiency and increased cost.4
Non-attendance may be the result of health inequality as it is closely associated with socioeconomic deprivation5,6 and geographical variation in service provision. Moreover, the ‘did-not-attend’ (DNA) rate is higher among underserved groups and ethnic minorities.7 Geographic Information Systems (GIS) have the capability to geocode ‘non-attender’ postal codes and postcode districts, conduct spatial analysis, and visualise the incidence and rate of DNA patterns across larger areas. In combination with the findings of the contributing factors to non-attendance (eg, socioeconomic deprivation), a local screening programme could use the information to aid allocation of healthcare resources and decision analytics on appropriate resource use.
Spatial analysis and GIS have been used in multiple studies. Soleimani and Bagheri examined the spatial distribution of myocardial infarction in rural Iran,8 Kuehnl et al analysed the spatial distribution and regional variation of the hospital incidence and in-hospital mortality of AAA in Germany9 and Khan et al explored attendance at the screening venues for breast cancer in Australia using spatial analysis and GIS.10 Yet, no study has investigated the spatial distribution of the NAAASP DNA incidence and rate in the UK. Therefore, we aimed to (1) identify the hotspots (postcode districts with high DNA incidence), (2) visualise the spatio-temporal pattern of DNA incidence throughout the years in these regions and (3) investigate the association between socioeconomic deprivation and non-attendance. The results of this study could enable policymakers to identify and target the areas at risk of a high DNA rate and incidence, which might improve uptake and access to the screening service in Cambridgeshire, Peterborough and West Suffolk in the UK.
Methods
This study was a retrospective spatio-temporal analysis of the DNA rate in the NAAASP in Cambridgeshire, Peterborough and West Suffolk in the UK from 2018 to 2022. Data were collected from the National AAA screening system, Screening Management and Referral Tracking (SMaRT), with attributes including contact postcode, GP practice and preferred language. Postcode district refers to the first half of the postcode/outward code (eg, CB1 is the postcode district of CB1 2RF). Postcode districts that fell outside the regional boundaries were excluded from the study. Men who were already under surveillance with the NAAASP were also excluded.
Men who attended their first screening appointment were classified as ‘attenders’ while men who missed their first screening appointment were classified as ‘non-attenders’. The DNA rate in each postcode district was calculated by dividing the number of non-attenders by the total number of non-attenders and attenders. Postcode districts with a statistically significantly higher DNA rate were identified using Fisher’s exact test with a Bonferroni correction for multiple tests.
The latitude and longitude coordinates of each postcode district and postal code were obtained from Ordnance Survey, the national mapping agency for the UK. These data were subsequently imported into Tableau software and ArcGIS Pro software for data visualisation and spatial analysis, respectively.
To identify statistically significant hotspots among postal district DNA incidences in the region, optimised hotspot analysis using the Getis-Ord Gi* statistics11 was used. A hotspot is defined as an area with a significantly higher DNA incidence and clustering compared with surrounding areas (ie, an area that has a greater than average number of DNA events). The output of hotspot analysis includes a P-value, a Z-score, and a confidence interval (CI) bin field (Gi-Bin) for each feature class (fishnet grid in this case). The fishnet grid in the ±3 bins reflects statistical significance with a 99% CI; the ±2 bins 95% CI; the ±1 bins 90% CI. The clustering for bin 0 is not statistically significant. The mean Gi-Bin value was then mapped with the polygonal shape of each postal district and visualised with ArcGIS software.
High risk areas were defined as regions with both a high DNA rate and high DNA incidence.
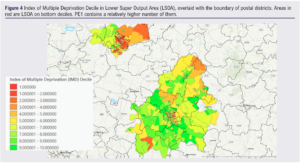
To investigate whether the degree of deprivation is associated with non-attendance, the index of multiple deprivation (IMD) decile of each Lower Super Output Areas (LSOA) from English indices of deprivation 201912 was mapped and overlaid with the boundary of postal districts using ArcGIS software. Multiple logistics regression was done in R to investigate the association of non-attendance with each of seven domains of degree of deprivation: income, employment, education, health and disability, crime, housing and living environment.
Results
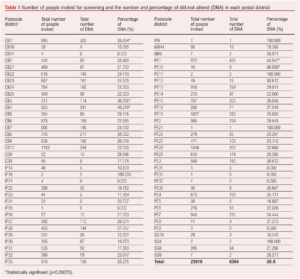
Between 2018 and 2022, 23,957 eligible men were invited for AAA screening in Cambridgeshire, Peterborough and West Suffolk. They resided in 95 different postcode districts. We excluded 28 postcode districts as they fell outside the service provision boundary, which amounted to 41 subjects being excluded. After exclusion, there were 23,916 eligible men who had been invited to an AAA screening appointment in the region, of which 17,552 attended the appointment and 6364 (26.6%) did not attend (Table 1).
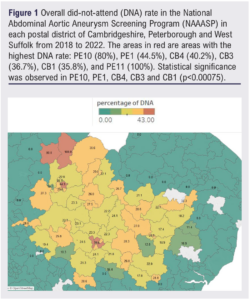
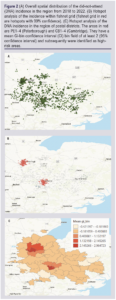
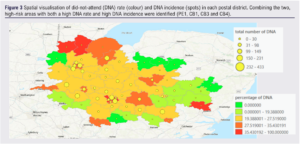
The highest statistically significant DNA rates were observed in postcode districts PE10 (n=8, 80%), PE1 (n=433, 44.5%), CB4 (n=331, 40.2%), CB3 (n=114, 36.7%) and CB1 (n=320, 35.8%) (p<0.00075) (areas in red in Figure 1). Using the number of non-attenders in each postcode district, optimised hotspot analysis identified eight statistically significant hotspots with a 95% confidence interval: PE1-4 (Peterborough), CB1-4 (Cambridge) (Figure 2). PE1, CB1, CB3 and CB4 were identified as areas with both high DNA rates and high DNA incidences (Figure 3).
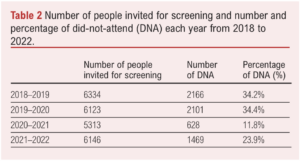
Across the years, the DNA incidence and DNA rate varied and diminished significantly in 2020/21. There were 2166 and 2101 non-attenders in the region in 2018/19 and 2019/20, respectively. The DNA incidence sharply decreased to 628 cases in 2020/21 and increased to 1469 in 2021/22 (Table 2). Similarly, the DNA rate was 34.2% and 34.3% in 2018/19 and 2019/20, respectively, yet in 2020/21 it dropped to 11.8% (p=0.0195) and rose to 23.9% in 2021/22. The total number of screening appointments followed a similar trend; there was a total of 6334 and 6123 appointments in 2018/19 and 2019/20 but then fell to 5313 in 2020/21, followed by an increase back to 6146 in 2021/22.
Optimised hotspot analysis across the years showed a consistent pattern. Peterborough city centre (PE1–4) was identified as a statistically significant hotspot with a 95% confidence interval every year from 2018 to 2022, despite a decrease in the DNA incidence in 2020/21. Interestingly, CB1,3,4 were identified as hotspots with a 95% confidence interval in all years apart from 2020/21.
By linking the 2019 IMD12 and postcode district, it shows that PE1 contains a relatively higher number of Lower Super Output Area (LSOA) on bottom deciles, indicating a possible link to socioeconomic factors. Despite being the hotspots, CB1–3 are relatively affluent with little socioeconomic deprivation, most of which being on the 3rd and 4th decile of IMD (Figure 4).
Multiple logistics regression showed that income (p<0.05), health deprivation and disability (p<0.05) and crime (p<0.005) were the three main contributing factors to non-attendance in Peterborough whereas, in Cambridge, there was a combination of factors: education, health deprivation and disability, crime, barriers to housing, living environment (all p<0.005).
Discussion
Key result
With an overall DNA rate of 26.6%, PE1, CB1, CB3 and CB4 were the non-attending areas with both a high proportionate rate of DNA and high absolute number of non-attendees. A consistent spatial distribution of DNA rate and incidence was observed from 2018 to 2022. However, there was a significant drop in the DNA rate and incidence in 2020/21, and only PE1–4 but not CB1,2,3,4 were detected as hotspots that year.
The degree of deprivation is found to be closely linked with non-attendance. However, the contributing factors differed between Peterborough and Cambridge. Income, health deprivation and disability, and crime contributed significantly to the non-attendance in Peterborough whereas there seems to be a combination of factors in play in Cambridge.
Interpretation
The overall DNA rate of 26.6% is higher than the nationally acceptable threshold of performance (<25%)13 and noticeably higher than the actual national DNA range of 19–23% from 2018 to 2022. These further pose urgency to policymakers to implement action and devise strategy for intervention.
The significant drop in the DNA rate in 2020/21 is most likely related to the impact of the COVID-19 pandemic. In March 2020 the initial screening and surveillance scans in the NAAASP were temporarily suspended for 9 months (until November 2020) and 5 months (until July 2020), respectively, leading to a drop in the total number of appointments. The greater drop in the DNA incidence and rate might be due to the greater willingness and availability of eligible men to attend appointments during the lockdown. It might be linked to social deprivation as men aged 65 and from socioeconomically deprived areas are more likely to work beyond their state pension age. During the pandemic their jobs with lower skills were more likely to be negatively impacted and to be furloughed,14 which might have increased their availability for screening appointments.
A similar pattern of uptake in the NAAASP was observed in other regions of the UK, according to the AAA standards report 2020–2021 published by NHS England.15 Interestingly, high outpatient attendance rates during the COVID-19 pandemic were observed in other studies.16-18 The summary report published by NHS England19 shows that the overall outpatient DNA rate was also lower in 2020/2021 compared with the previous years. However, it should be noted that the temporal drop is likely to be an exception and is not shown to affect the causes of the overall distribution of non-attendance.
Socioeconomic deprivation and its association with non-attendance has recently been investigated and reported in various publications.6,7 The general findings are that non-attendance is more prevalent in socioeconomically deprived areas,7 which could be attributed to various factors including health deprivation and disability, outdoor living environment and adult education.6 Whereas this is consistent with our findings in Peterborough, CB1–4 has been identified as hotspots with relatively little socioeconomic deprivation, which is an exception to the current literature finding. It might be due to the large working population in the region, yet the multiple logistics regression revealed a combination of factors might be in play, which warrants further research.
Limitations
One of the limitations of this study is data availability. Smoking history and a family history of AAA are important risk factors for AAA, yet this information is not routinely collected from men who are invited to the screening programme. Throughout the study period the location of screening clinics also changed considerably on a yearly basis due to the availability of facilities. Ease of access to screening clinic, smoking and family history of AAA could all influence both non-attendance and socioeconomic status. Yet, without these data, we could not investigate the potential confounding factors and their impact.
Future work
The study findings warrant future research to investigate the association between the DNA rate and different factors such as index of deprivation, ethnic mix, first language spoken and the distance to the screening clinic. This could be achieved by geographic weighted regression. Combining an understanding of the risk factors and the geographical distribution impacting non-attendance would facilitate the most targeted future quality improvement interventions.
It is suggested that the study findings be communicated with the local screening programmes for improving uptake in non-attending areas, including targeted actions such as booking more accessible venues for subjects with a disability or a safer screening location to tackle the deterrent effect of crime on attending screening appointments, especially in Peterborough. Follow-up spatio-temporal analysis should be done to evaluate the effectiveness of the intervention.
Conclusion
PE1, CB1, CB3 and CB4 were identified as non-attending areas of NAAASP with a high DNA incidence and rate. There was a significant drop in the non-attendance rate and incidence in 2020/21 during the COVID pandemic, and only PE1–4 but not CB1,2,3,4 were detected as hotspots that year. The degree of deprivation is found to be closely linked with non-attendance in Peterborough but less evident in Cambridge. The contributing factors to non-attendance can differ between regions. Future research is warranted to investigate the association between the DNA rate and different factors such as index of deprivation, ethnic mix, first language spoken and the distance to the screening clinic. It is suggested that the findings are regularly communicated with the local screening programme to devise a targeted strategy in order to improve uptake in non-attending areas.
Article DOI:
Journal Reference:
J.Vasc.Soc.G.B.Irel. 2023; 3(1): 19-25
Publication date:
September 19, 2023
Author Affiliations:
1. Department of Vascular Surgery, Cambridge University Hospital NHS Foundation Trust, Cambridge, UK
Corresponding author:
Simon Kreckler
Cambridge Vascular Unit, Box 212, Addenbrookes Hospital, Hills Road, Cambridge,
CB2 0QQ, UK
Email: [email protected]


")

")

